Defining a “Super User Journey”
Streamlining previously designed user journeys into one to serve as the user base of the Service Blueprint project
Organisation: Drinkaware (UK charity focused on reducing alcohol-related harm)
Role: Junior UX Designer. Sub-project lead but consulted stakeholders during mapping sessions to iterate and improve the journey design.
Overview
Purpose: To simplify and streamline the previously designed dynamic user journeys into a single, high-level “Super User Journey” that could serve as the foundation for Drinkaware’s service blueprint.
This top-level journey aimed to align user behaviour with the organisation’s Theory of Change and provide a consistent reference that connected user needs with organisational outcomes via the wider Service Blueprint project.
Problem / Challenge
The user journeys I had previously created were rich but complex, with multiple dynamic paths including loops, re-entries, and backwards movement.
However, to support the Service Blueprint project, stakeholders required a simplified, linear model that could:
Represent a full user lifecycle across the Drinkaware ecosystem
Cross-reference behavioural stages of change
Align with the organisation’s Theory of Change
Be easily interpreted across teams
Design
Although this project didn’t involve traditional UI design, it required strong information design and visual communication to ensure the journey map was clear, flexible, and usable by stakeholders.
This design-first thinking helped transform a complex, abstract concept into a tangible artefact that could anchor service design decisions.
Key design considerations:
Visual hierarchy: I created layered flows to separate user behaviour, emotional cues, and organisational outcomes. This allowed stakeholders to focus on one aspect at a time or view the full picture holistically.
Clarity over complexity: I intentionally kept step labels general and avoided overloading the map with granular detail, ensuring the output remained accessible to non-UX teams.
Emotional mapping: I used emoji symbols and tone indicators to reflect key emotional shifts along the journey—an unconventional but effective way to signal dynamic experience without clutter.
Legend and annotations: To help diverse teams interpret the map, I included a visual legend, and a separate layer of supporting notes explaining each journey step.
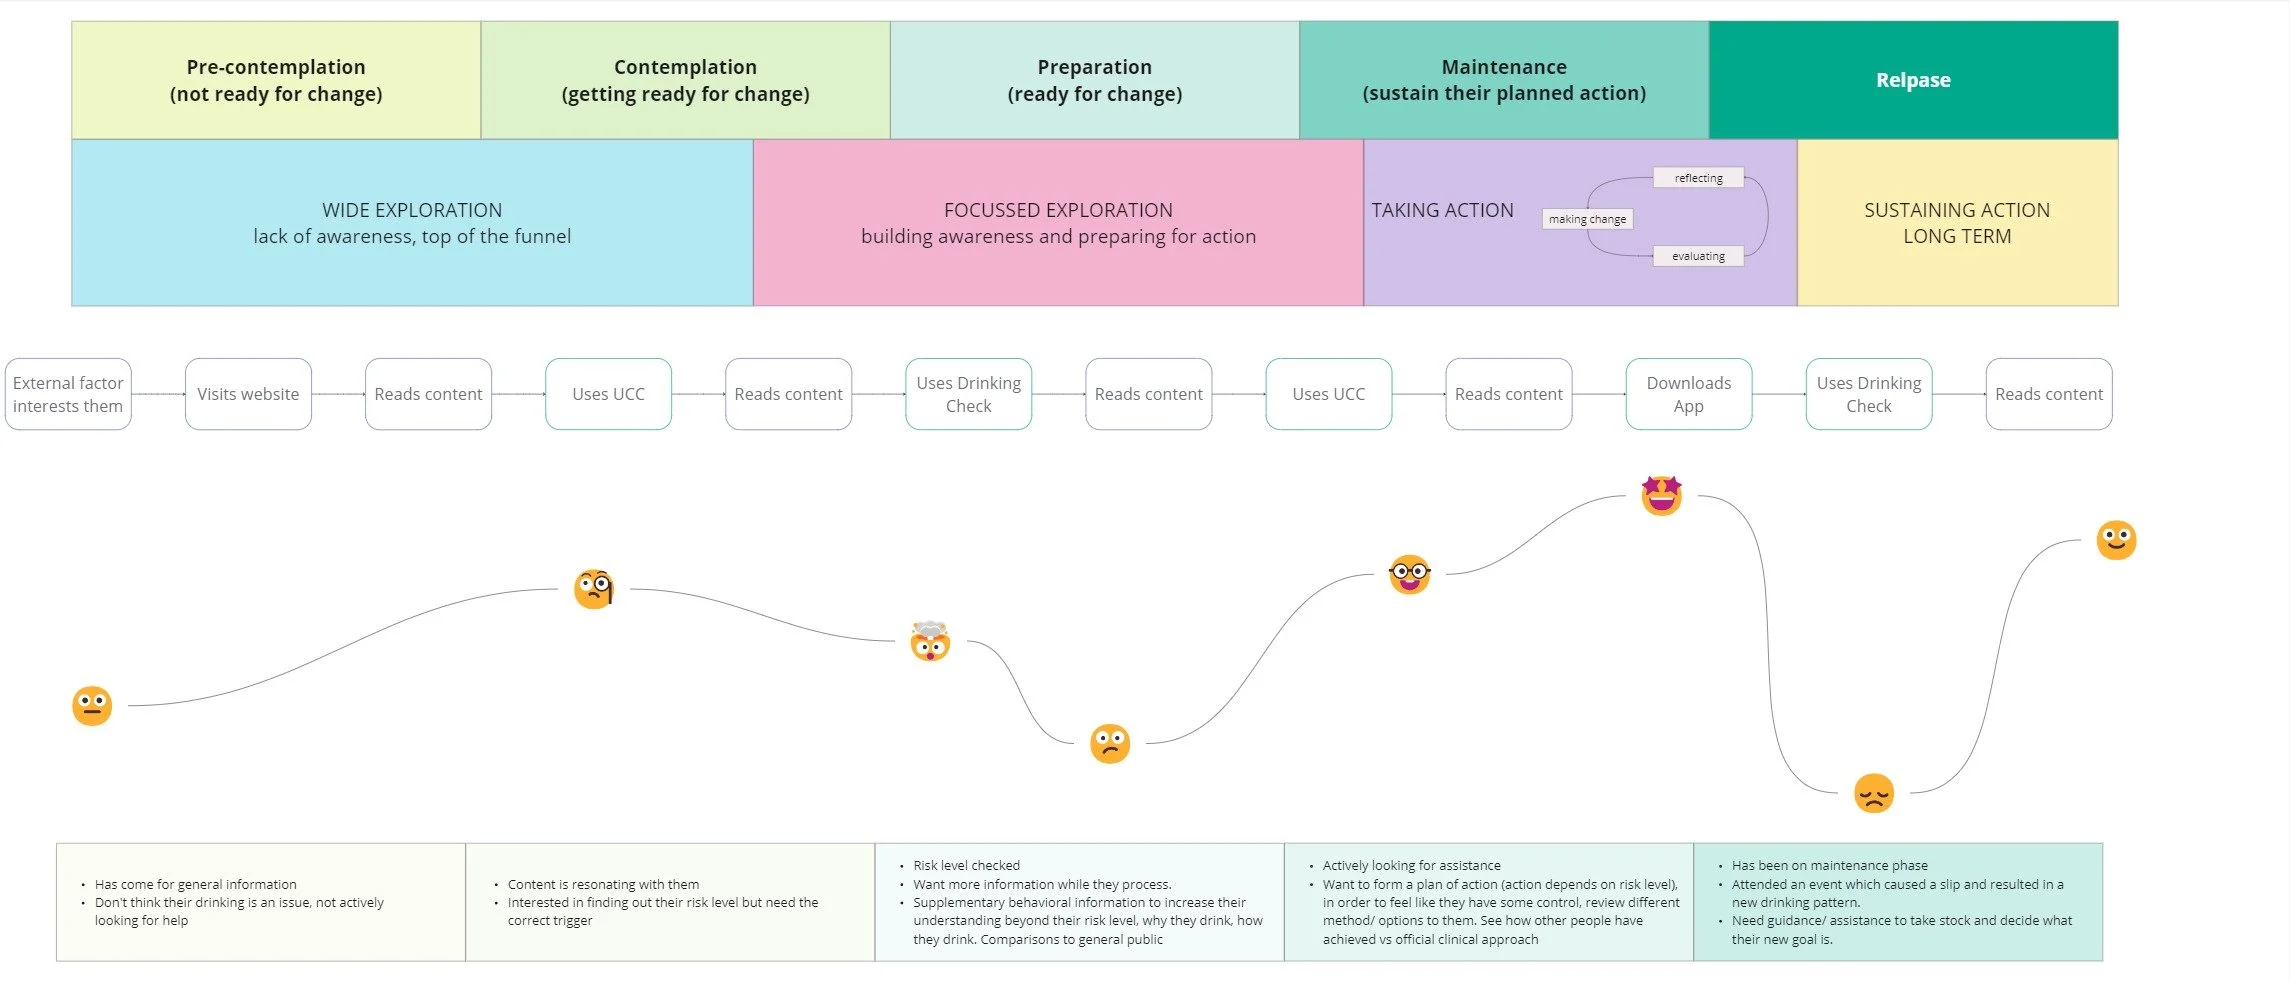
Initial draft
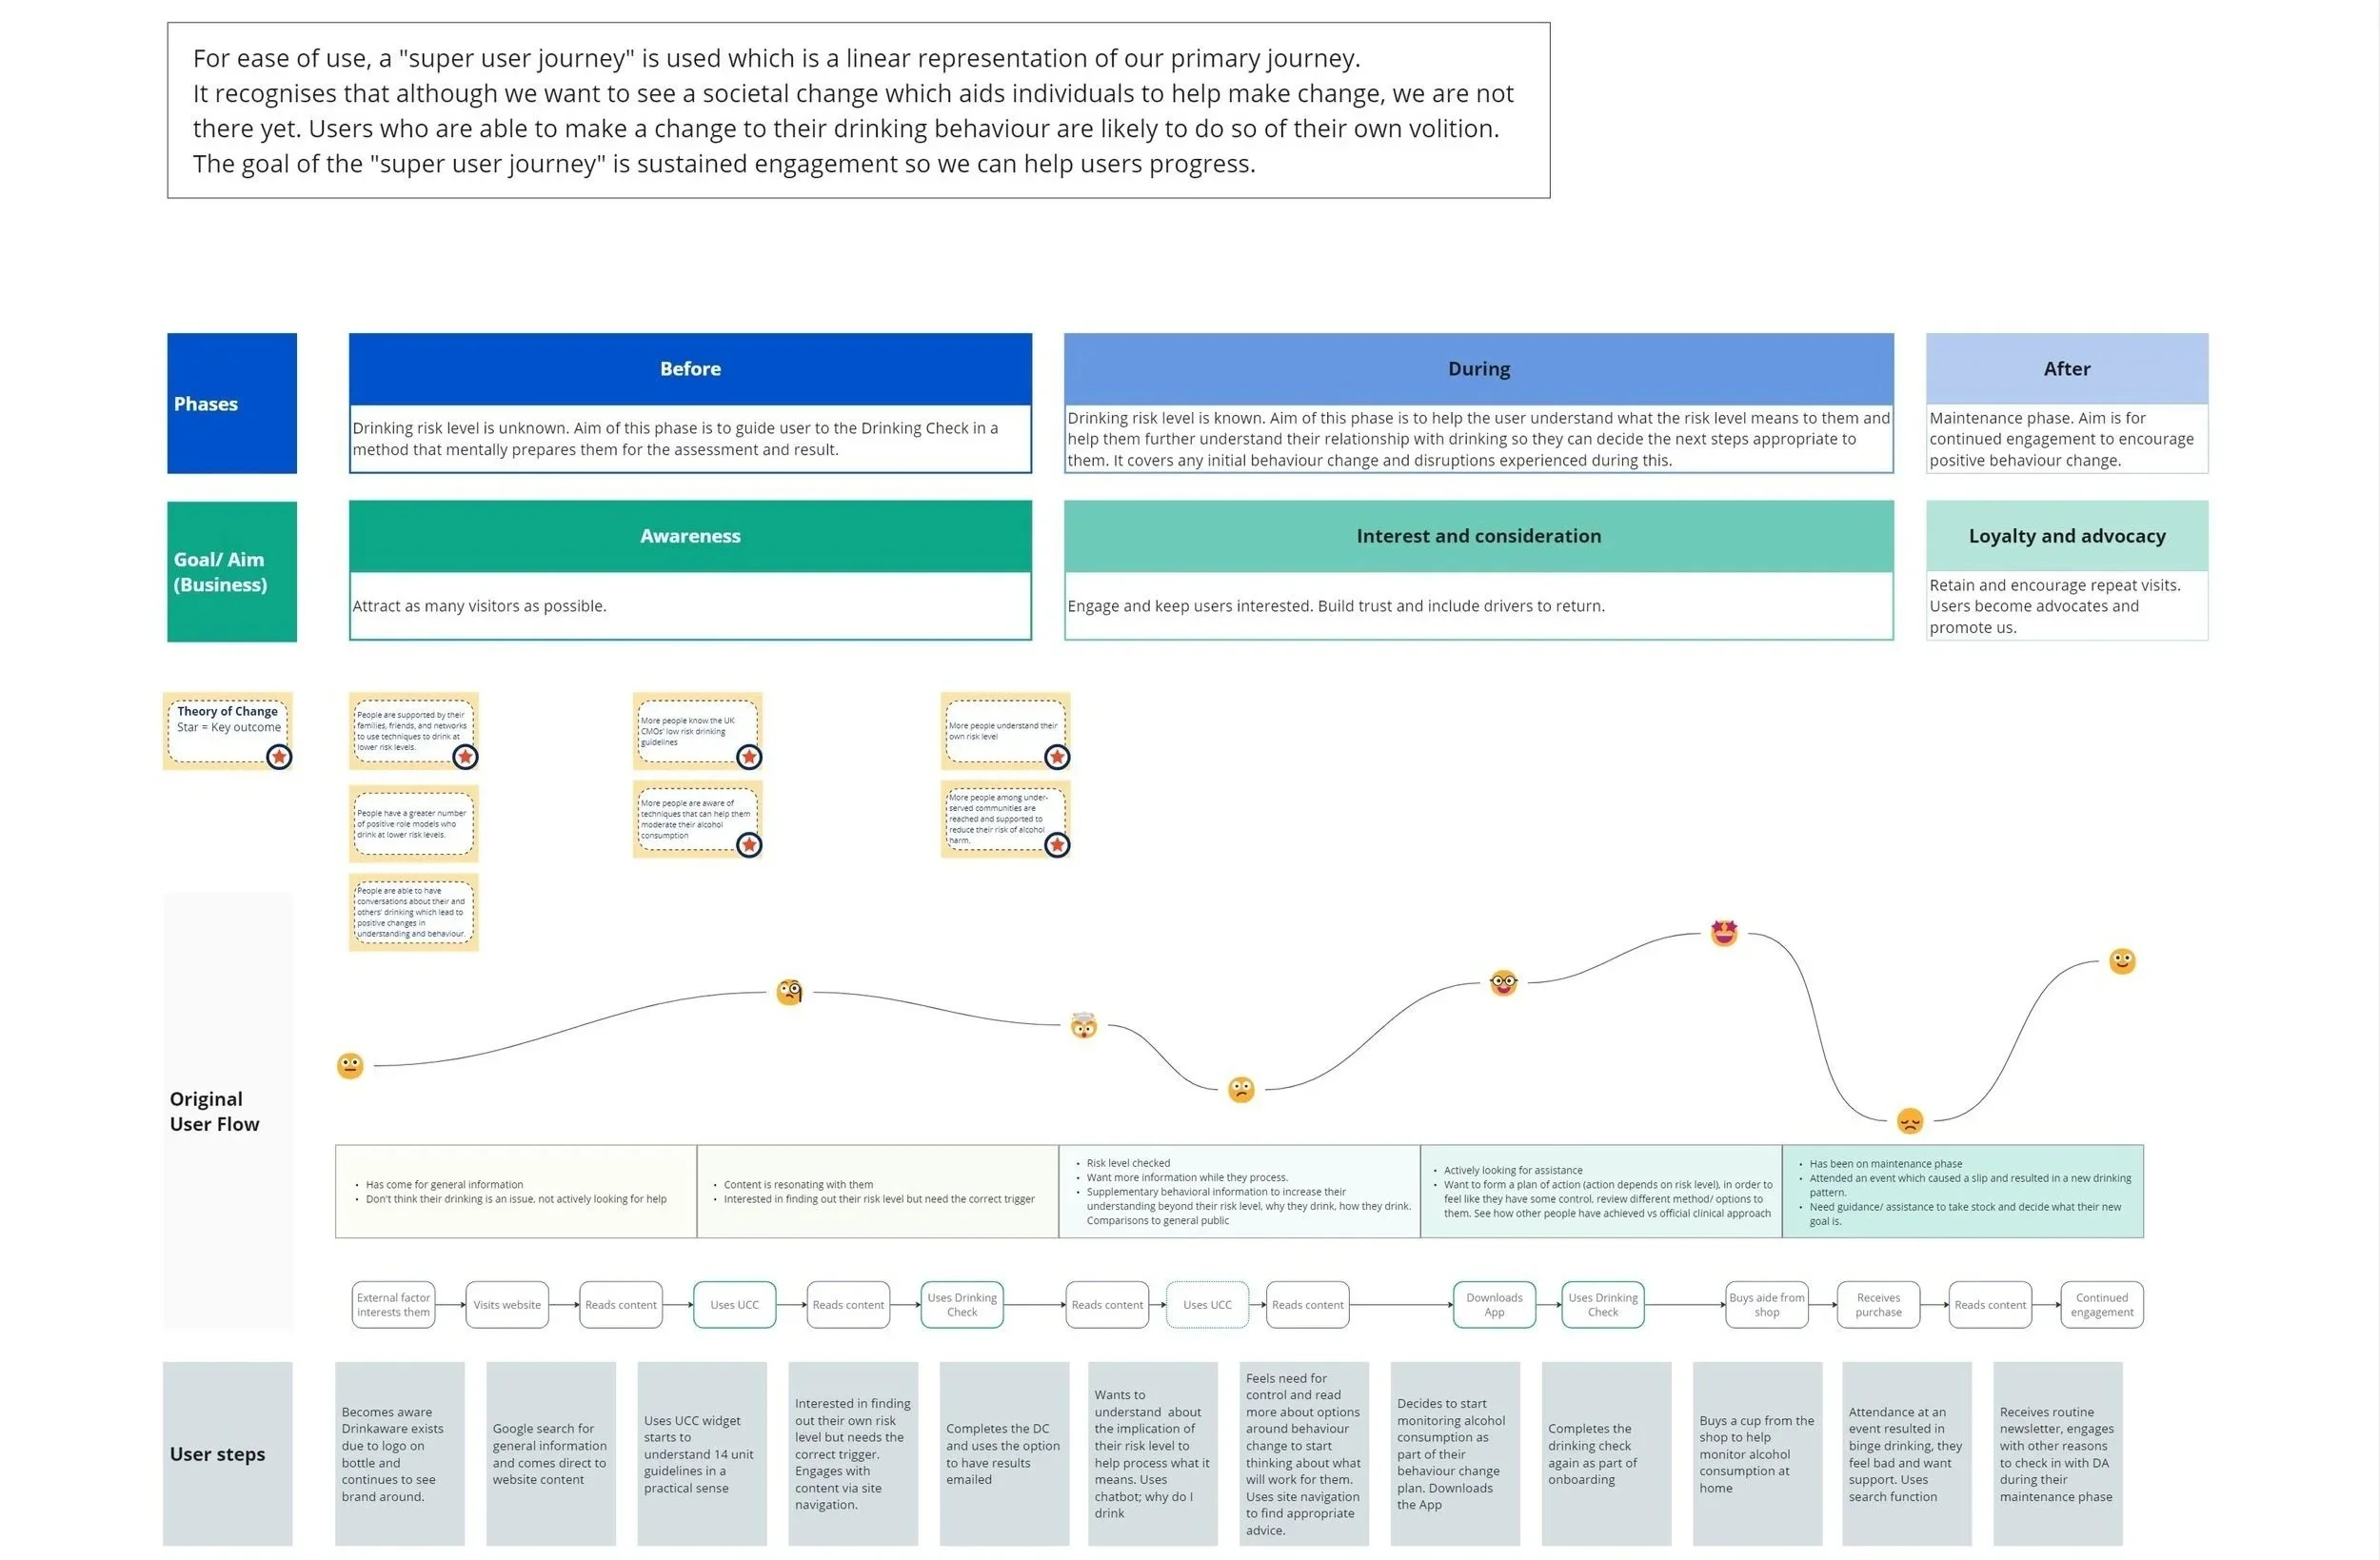
Final version (placed in the Service Blueprint)
Final Solution
I developed a high-level, visual user journey template that served as the foundation for the organisation’s service blueprint.
The final deliverable included:
A simplified, linear journey that mapped all major user phases across the Drinkaware digital estate
Behaviour change stages merged into broader, layered phases (e.g., “awareness of risk” as a key turning point)
Key touchpoints aligned with digital tools such as the Drinking Check and the App
A newly identified step for Shop purchases, previously absent from the map, added to surface an existing but overlooked solution.
A bottom layer detail describing each step to maintain clarity without crowding the main journey
Emotional overlays representing user highs and lows, ensuring that the journey stayed human-centred despite its linear format
Outcome: The “Super User Journey” became a shared reference tool for cross-functional teams during the Service Blueprint project, enabling alignment between user behaviour, internal processes, and strategic goals.
See Service Blueprint project for implementation and use (link below).